How to Use PARALLELPERIOD In Power BI
PARALLELPERIOD is a DAX function that returns a table that contains a series of dates parallel to the dates to the function. This function can be used to calculate numeric columns over a given timeframe and supports monthly, yearly, and quarterly intervals.
PARALLELPERIOD Syntax
The DAX syntax for PARALLELPERIOD is simple and can be seen below:
The arguments that this function require are details below.
PARALLELPERIOD(<dates>, <number_of_intervals>, <interval>) | Term | Definition |
| dates | A column that contains dates. |
| Number_of_intervals | An integer that specifies the number of intervals to add to or subtract from the dates. |
| interval | The interval by which to shift the dates. The value for interval can be one of the following: year, quarter, month. |
How to Use PARALLELPEROPD
As shown and explained above, the PARALLELPERIOD function is quite simple to use. We can use this function to calculate total sales over the last 12 months, total revenue over the last 12 months etc.
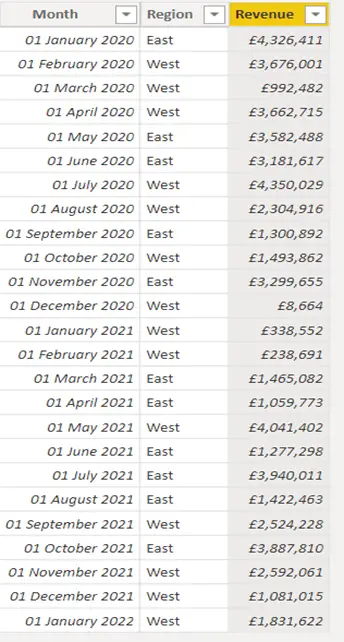
I have a dataset that contains columns ‘Month’, ‘Region’ and ‘Revenue’, all of which have data in them. The month column has months from January 2020 – January 2022.
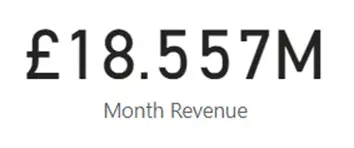
We can use the below formula to create a calculated measure that will sum our revenue 17 months from the current month.
Month Revenue =
    CALCULATE(
        SUM('RLS Data'[Revenue]),
        PARALLELPERIOD('RLS Data'[Month], 17, MONTH)
    )
By using the above formula, we get a calculated sum of £18.557M. You can see in the dataset that we have data until January 2022, so the formula is summing all revenue from the current month (September) – 17 months ago (June 2021).
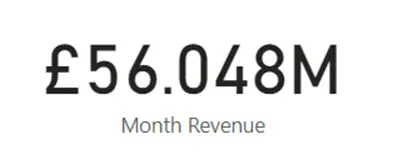
We can also use a negative number, so it starts from the earliest month.
Month Revenue =
    CALCULATE(
        SUM('RLS Data'[Revenue]),
        PARALLELPERIOD('RLS Data'[Month], -1, MONTH)
    )
What this formula does, is sum the revenue from the earliest month – the second to last month (January 2020 – December 2021).
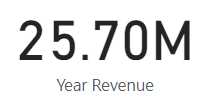
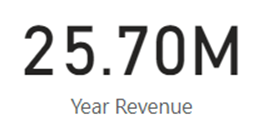
We can also use ‘YEAR’ as the interval and calculate the revenue over the last year from the latest date.
Year Revenue =
    CALCULATE(
        SUM('RLS Data'[Revenue]),
        PARALLELPERIOD('RLS Data'[Month], 1, YEAR)
    )
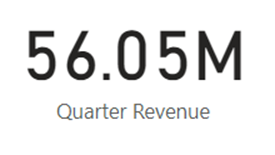
We can also use ‘QUARTER’ as the interval and calculate the revenue from the earliest date to the end of the last quarter (January 2020 – December 2021).
Quarter Revenue =
    CALCULATE(
        SUM('RLS Data'[Revenue]),
        PARALLELPERIOD('RLS Data'[Month], -1, QUARTER)
    )
Finishing Off
Now that you know how to use the PARALLELPERIOD function, you can use this in your report to do multiple calculations. This function is extremely powerful and is useful to know if you wish to easily calculate totals over a specific timeframe.
Please note the following points on the PARALLELPERIOD function:
- The ‘number_of_intervals’ argument passed through as a positive number, will move the dates forward in time; backwards in time if the ‘number_of_intervals’ argument passed through as a negative number.
- The ‘inertval’ argument must not be passed as a string, instead, they should be passed as they are shown and not in quotation marks. E.G. ‘YEAR’, ‘QUARTER’, ‘MONTH’.
- Unfortunately, the PARRALELPERIOD function is not supported with row-level security (RSL) rules.
For more useful blogs, please visit Learn DAX