How to Use DATESINPERIOD In Power BI?
DATESINPERIOD is a DAX function that returns a table that contains a column of dates that starts with a specified start date and continues for the specified length based on the type of date interval passed to the function.
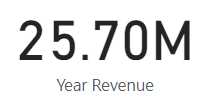
This type of function is extremely useful when you want to show important figures such as sales, volume, customers etc over a given period of time and is easy to implement into your report.
DATESINPERIOD Syntax
The DATESINPERIOD function can be written as the below.
DATESINPERIOD(<dates>, <start_date>, <number_of_intervals>, <interval>)| Term | Definition |
| dates | A date column. |
| start_date | A date expression. |
| number_of_intervals | An integer that specifies the number of intervals to add to, or subtract from, the dates. |
| interval | The interval by which to shift the dates. The value for interval can be one of the following: DAY, MONTH, QUARTER, and YEAR |
How to Use DATESINPERIOD
We have shown you the syntax for the DATESINPERIOD function and an explanation of the parameters, but how do we use the DAX function?
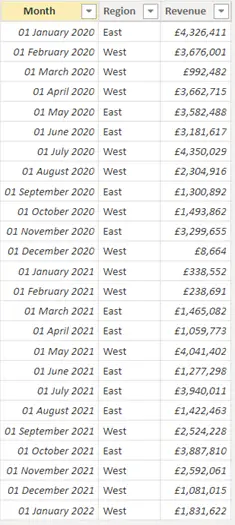
I have a dataset that contains sales data over a period of 2 years. I can then use a CALCULATE function to SUM the revenue and add the DATESINPERIOD.
We can do the below formula to get the total sales revenue over the previous year.
Revenue PY =
    CALCULATE(
        SUM('RLS Data'[Revenue]),
        DATESINPERIOD(
            'RLS Data'[Month],
            MAX('RLS Data'[Month]),
            -1,
            YEAR
        )
    )
A breakdown of the formula:
CALCULATE(
        SUM('RLS Data'[Revenue])
The above uses the CALCULATE and SUM functions to sum the revenue.
DATESINPERIOD(
'RLS Data'[Month],
        MAX('RLS Data'[Month]),
       -1,
       YEAR
)
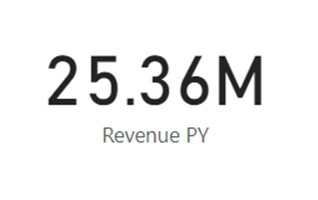
The above uses the DATESINPERIOD function to select the month column, then finds the maximum date, and then filters the date column to 1 year ago.
By using this formula, we are able to get the below value.
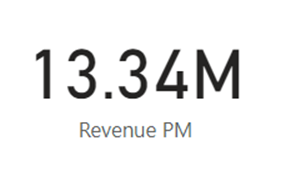
We can also change the formula and show the total revenue by simply changing the ‘number_of_intervals’ to -6, and the ‘interval’ to MONTH.
Revenue PM =
    CALCULATE(
        SUM('RLS Data'[Revenue]),
        DATESINPERIOD(
            'RLS Data'[Month],
            MAX('RLS Data'[Month]),
            -6,
            MONTH
        )
    )
However, we can get the same result as above by using ‘QUARTER’ as the interval.
Revenue PM =
    CALCULATE(
        SUM('RLS Data'[Revenue]),
        DATESINPERIOD(
            'RLS Data'[Month],
            MAX('RLS Data'[Month]),
            -2,
            QUARTER
        )
    )

Finishing Off
Now that you know how to use the DATESINPERIOD function, you can use this in your report to do multiple calculations. This function is extremely powerful and is useful to know if you wish to easily calculate totals over a specific timeframe.
Please note the following points on the DATESINPERIOD function:
- The ‘number_of_intervals’ argument passed through as a positive number, will move the dates forward in time; backwards in time if the ‘number_of_intervals’ argument passed through as a negative number.
- The ‘interval’ argument must not be passed as a string, instead, they should be passed as they are shown and not in quotation marks. E.G. ‘YEAR’, ‘QUARTER’, ‘MONTH and ‘DAY’’.
- Unfortunately, the DATESINPERIOD function is not supported with row-level security (RSL) rules.
Please visit Learn DAX for more dax functions