Leveraging SQL Server for Business Intelligence
Introduction
Business Intelligence (BI) is the process of transforming data into information that can help businesses make better decisions.
BI can help businesses understand their performance, identify opportunities, resolve problems, and optimize their strategies. BI can also help businesses gain a competitive edge in the market and improve customer satisfaction.
SQL Server is a powerful and versatile tool for BI as it offers various features such as relational databases, data warehouses, data integration, data analysis, data mining, reporting, and visualization.
SQL Server can handle different types of data, both structured and unstructured, and provide fast and reliable access to data. SQL Server can also integrate with other Microsoft products, such as Azure, Power BI, and Excel, to enhance BI capabilities.
In this article, we’ll review how SQL Server can be used to drive BI, including:
- How to use SQL Server to create and manage data sources for BI
- How to use SQL Server to perform data analysis and data mining for BI
- How to use SQL Server to generate reports and dashboards for BI
- How to use SQL Server to implement BI decision-making strategies
By the end of this article, you will better understand how SQL Server can help you leverage your data for BI and understand better how a SQL training course focused on BI could help you.
So, let’s get started without further ado.
SQL Server Data Sources for BI
A key aspect of BI is having reliable and relevant data sources that can provide the data needed for analysis and reporting.
SQL Server can be used to create and manage various data sources for BI, some of which include:
Relational databases
SQL Server is a relational database management system (RDBMS) capable of storing and manipulating data in tables organized in rows and columns. SQL Server provides tools such as SQL Server Management Studio (SSMS) or Transact-SQL (T-SQL) to create tables, views, stored procedures, functions, triggers, and indexes.
Relational databases are suitable for storing structured data that follows a predefined schema and has well-defined relationships.
For example, you can run this script in the SSMS to create the Pubs dataset and then run the following SQL server query to retrieve records from the sales, stores, and titles tables.
| SELECT TOP 10 s.ord_num, s.ord_date, s.qty, s.payterms, st.stor_name, t.title_id FROM dbo.sales s INNER JOIN dbo.stores st ON s.stor_id = st.stor_id INNER JOIN dbo.titles t ON s.title_id = t.title_id; |
Output:
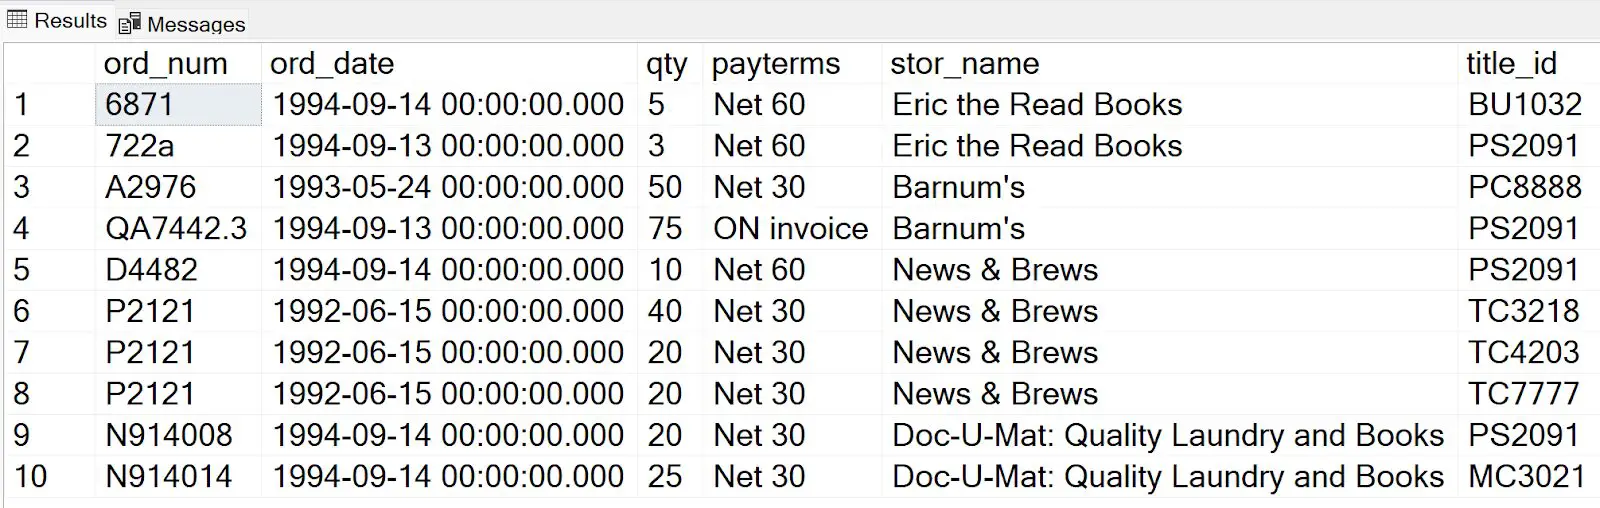
This is a naive example, but it demonstrates the power of SQL servers and associated tools to import and process data.
Data warehouses
A data warehouse is a centralized repository that integrates data from various sources, such as operational systems, external sources, or other databases. SQL Server provides tools such as SQL Server Integration Services (SSIS) or Azure Data Factory to extract, transform, and load (ETL) data from various sources into a data warehouse.
Data warehouses are suitable for storing structured or semi-structured data that follows a dimensional model and supports aggregation and analysis.
Data lakes
A data lake is a large-scale storage system that stores and processes large volumes of structured, semi-structured, and unstructured data. A data lake can provide a flexible and scalable way to store and access data and support advanced analytics and machine learning. SQL Server provides tools such as SQL Server Big Data Clusters or Azure Synapse Analytics to store and process data in a data lake.
Data lakes are suitable for storing diverse and complex data that does not follow a fixed pattern and requires high performance and scalability.
Once you have decided on the data source, SQL Server can integrate with various BI data analysis and data mining tools.
Data Analysis and Data Mining for BI with SQL Server
Data analysis and mining are two processes that can help businesses better understand their data and support their decision-making.
SQL Server provides various tools for data analysis and data mining tasks for BI.
Data analysis
SQL Server can create multidimensional or tabular models that can be queried using MDX or DAX, using tools such as SQL Server Analysis Services (SSAS) or Azure Analysis Services.
SSAS and Azure Analysis Services are data analysis tools that can provide fast and flexible access to data and support complex calculations and business logic.
Data mining
SQL Server can apply various algorithms and techniques to discover patterns and trends in data by integrating with tools such as SQL Server Data Mining or Azure Machine Learning.
SQL Server Data Mining and Azure Machine Learning are data mining tools that integrate with SQL Server databases, data warehouses, data lakes, or analytics services and provide features such as preparation, data exploration, modeling, validation, and deployment.
SQL Server Reporting and Visualization for BI
Reporting and visualization are essential for BI because they can help present and communicate data clearly and concisely and support data exploration and discovery, data storytelling, and decision-making.
SQL Server can generate reports and visualizations for BI.
Reports
SQL Server can design, publish, and distribute interactive and paginated reports using tools like SQL Server Reporting Services (SSRS) or Power BI Report Server.
SSRS and Power BI Report Server are report server platforms that can connect to various data sources, such as SQL Server databases, data warehouses, data lakes, or analytics services.
They can provide report creation, management, delivery, and security features.
Visualization
Using tools like Power BI Desktop or Power BI Service, you can use SQL Server database to create and share stunning and dynamic data visualizations. Power BI Desktop and Power BI Service are data visualization tools that connect to various data sources, such as SQL Server databases, data warehouses, data lakes, or analytics services.
They can also provide features such as data modeling, transformation, visualization, exploration, and collaboration.
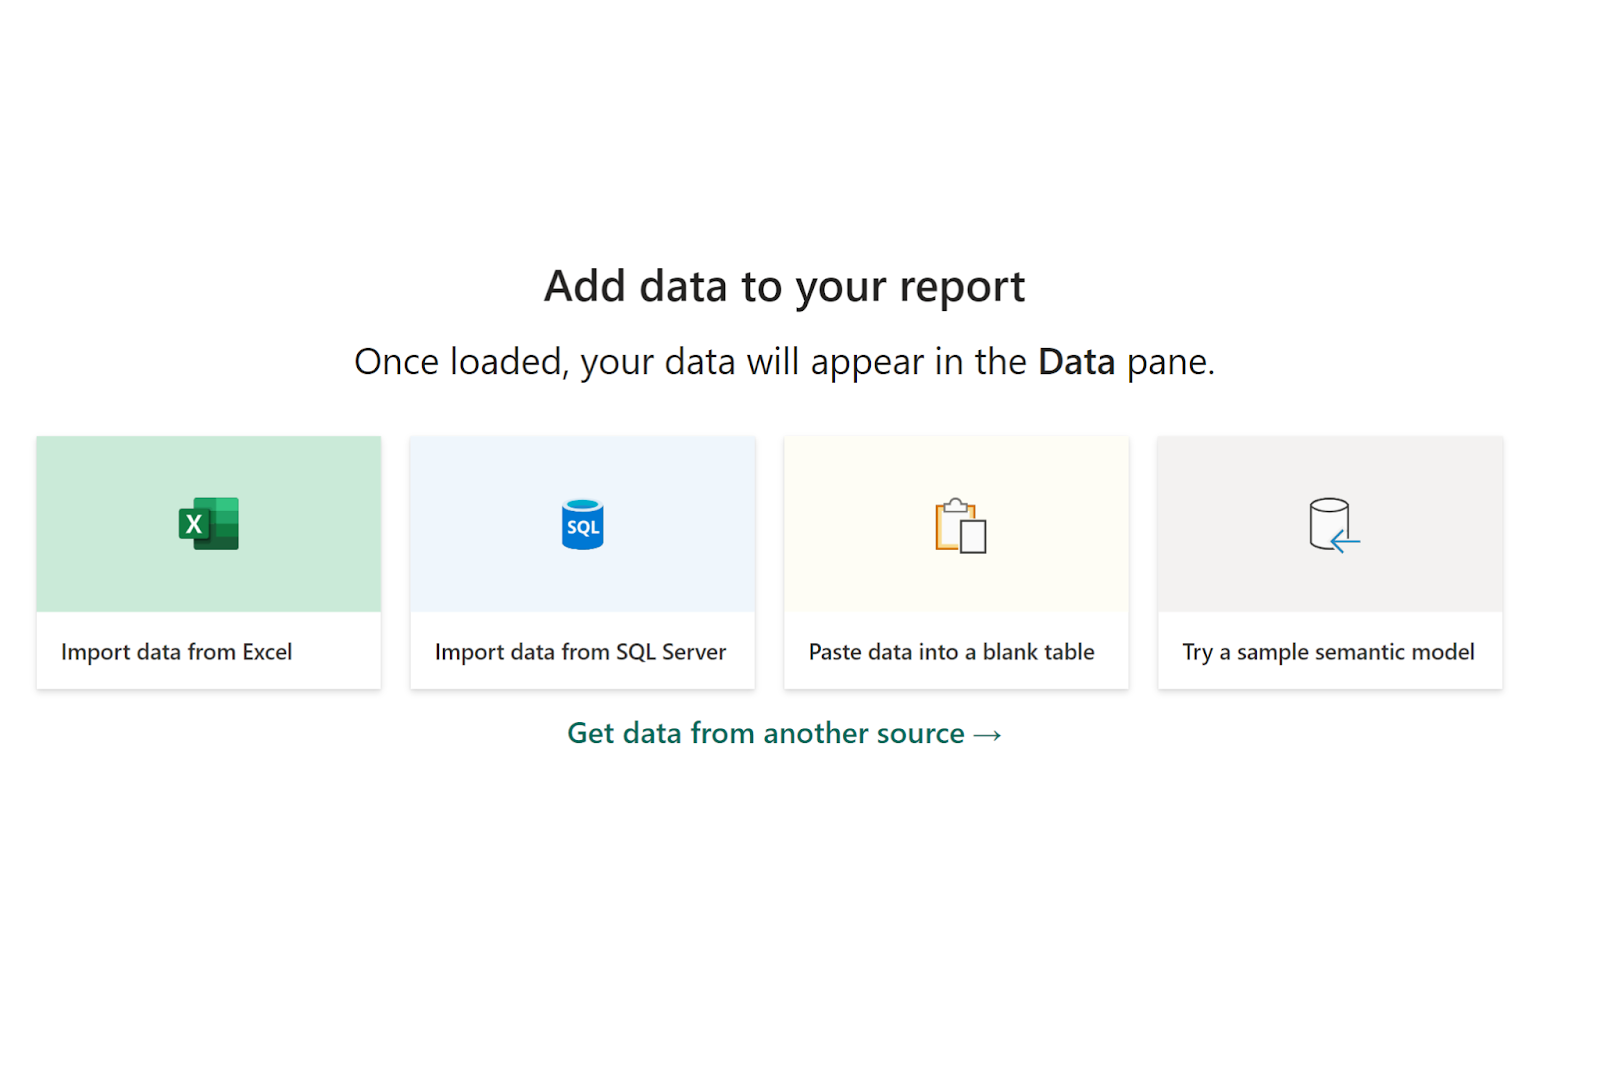
For example, when you open the Power BI dashboard on your local system, you will see options to import data from SQL Server.
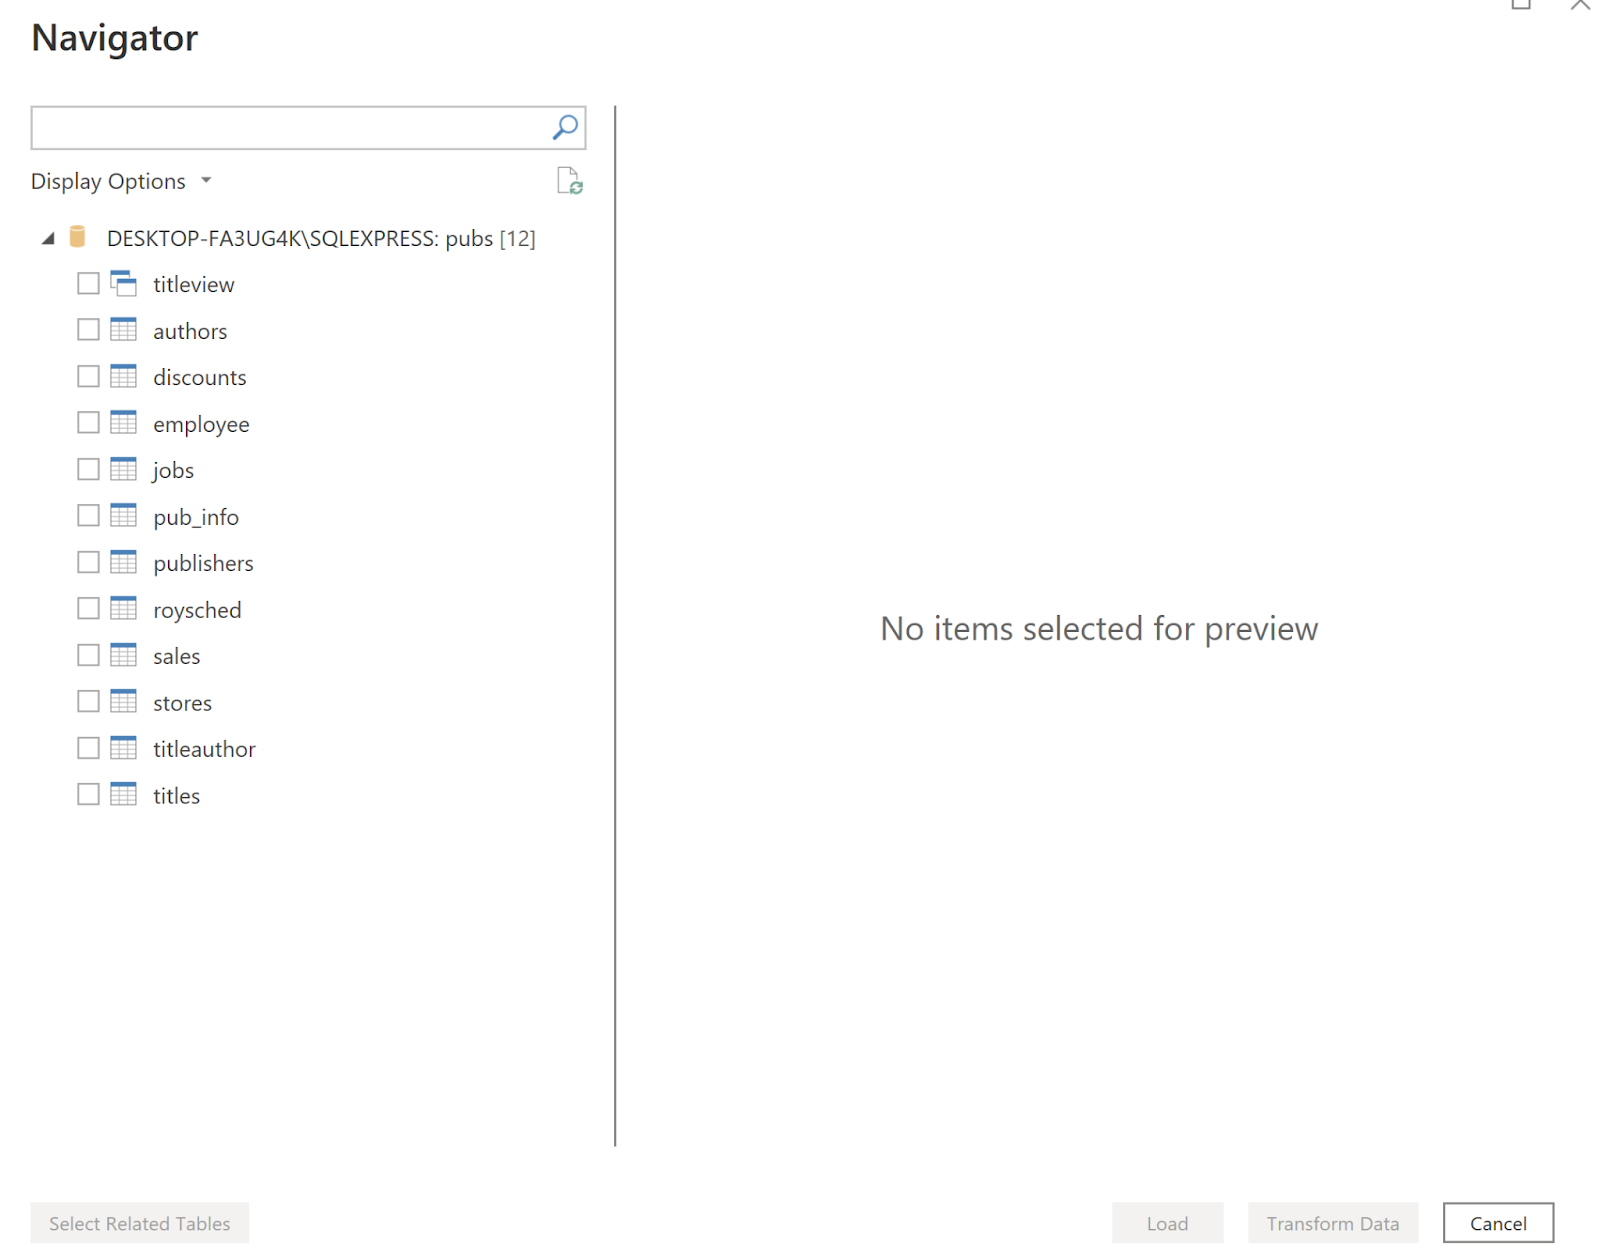
For example, the following screenshot shows the tables imported from the `pubs` dataset from an SQL Server instance.
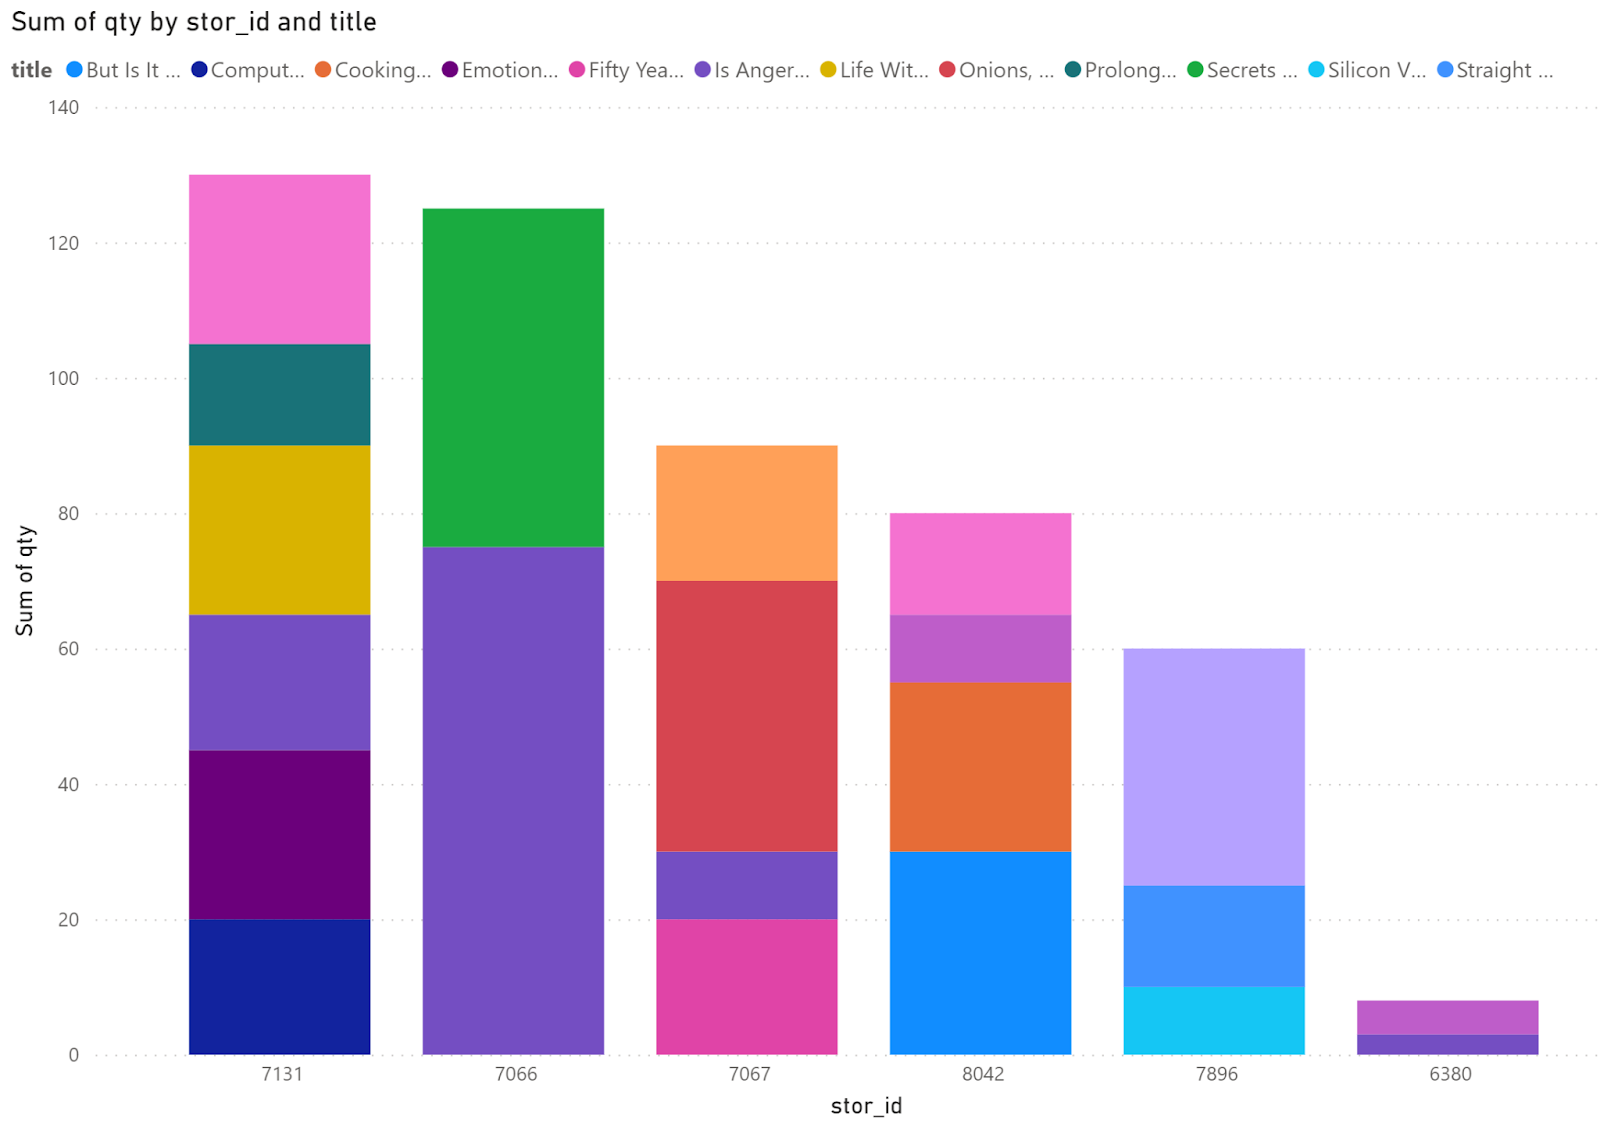
You can create various visualizations using the selected tables. For instance, the following screenshot displays a bar chart that displays the sale quantity for all titles in the Pubs dataset for each store.
Decision-Making Strategies for BI
Decision-making is the most crucial aspect of BI, as it can help businesses take actions that can improve their performance, efficiency, and profitability.
Decision-making involves using analytics, data mining, reporting, and visualization, which we have mentioned in previous sections, to support various types of decisions, such as descriptive, predictive, and prescriptive.
SQL Server can be used to implement decision-making strategies for BI, such as:
Descriptive analysis
Descriptive analytics can help businesses understand past events, such as sales, revenue, costs, customer behavior, and market trends. Descriptive analytics can also help businesses monitor their current performance, such as key performance indicators (KPIs), dashboards, and scorecards.
SQL Server can meaningfully perform descriptive analysis of current and historical data using tools such as SQL Server databases, data warehouses, data lakes, SSRS, or Power BI.
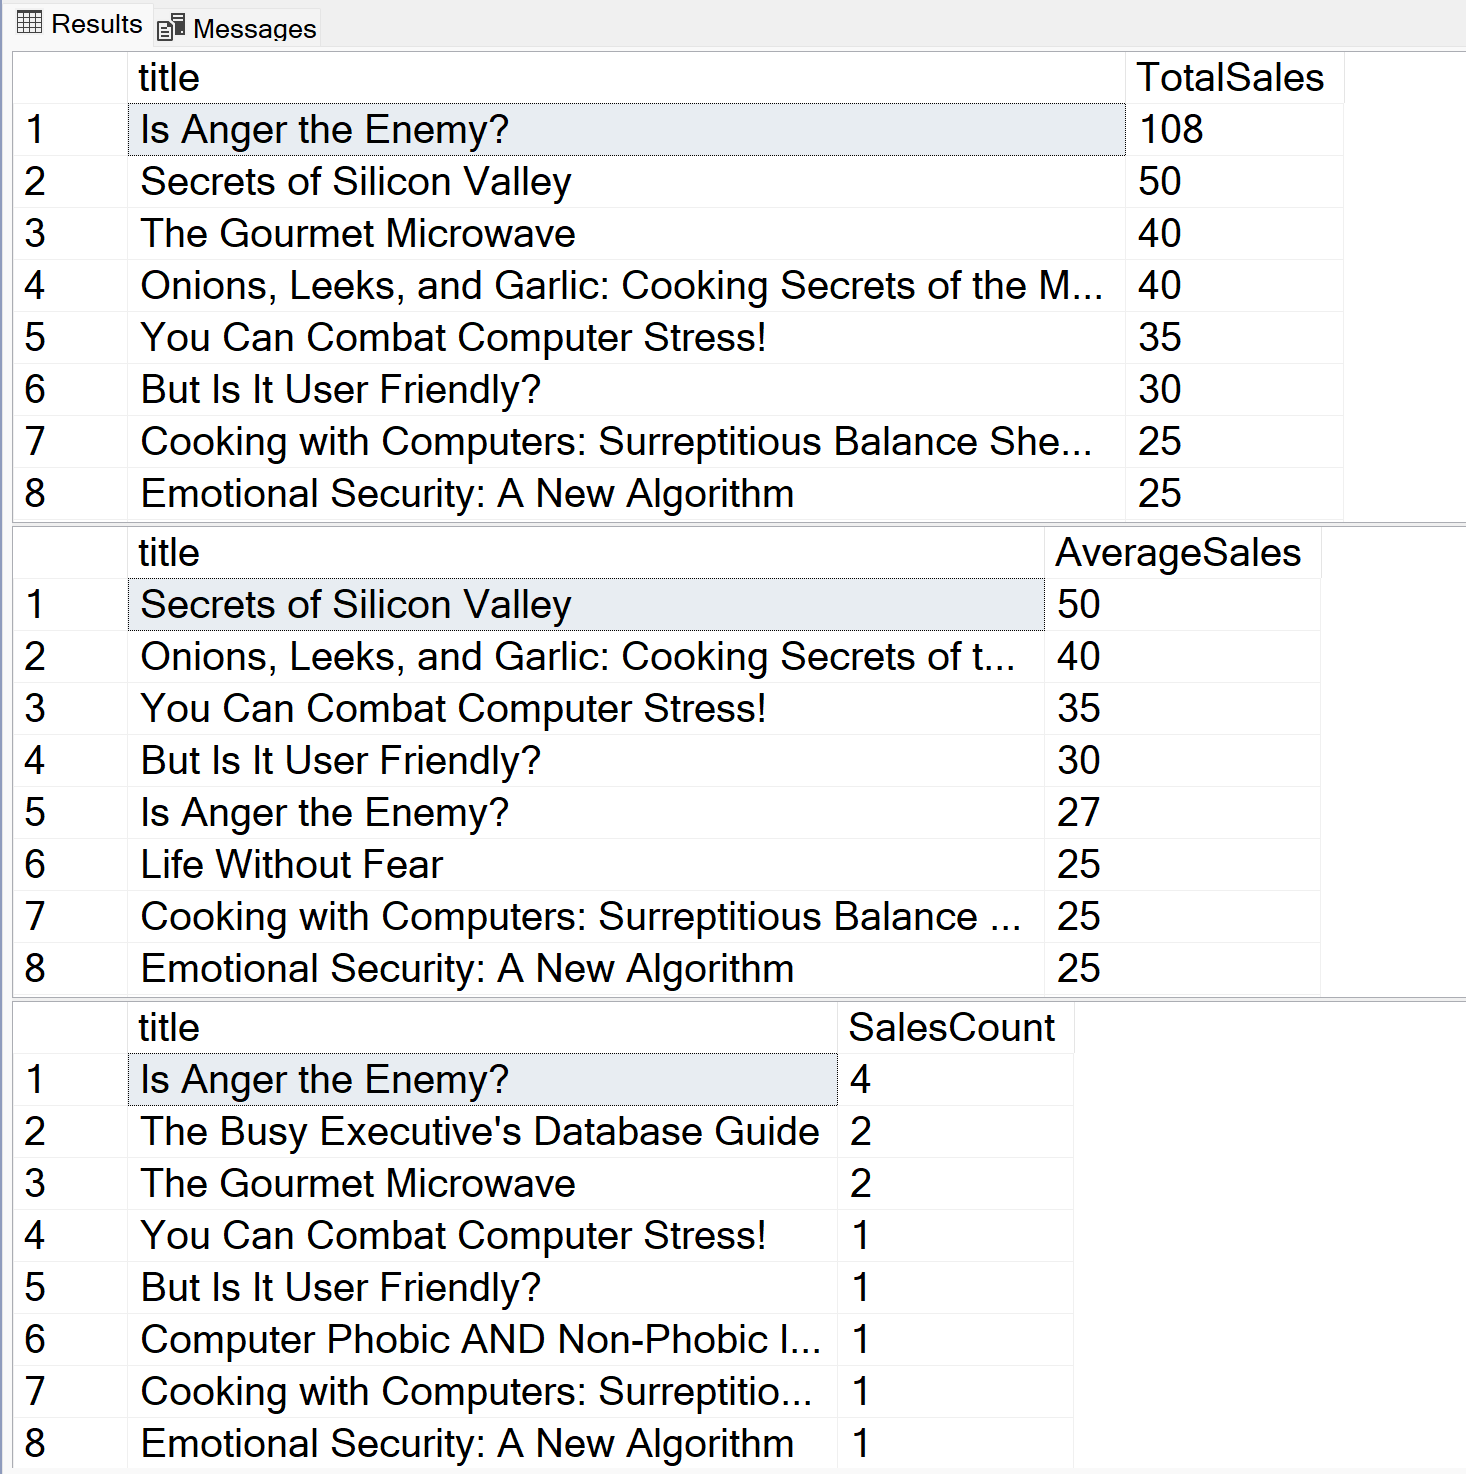
Let’s again use the’ pubs’ dataset to demonstrate how SQL Server can be used for descriptive analysis.
Let’s consider a scenario where you want to analyze sales data to calculate total sales, average sales, and sales count for each title. You can do so with the help of the following script:
| USE pubs; — 1. Total Sales by Title SELECT t.title, SUM(s.qty) AS TotalSales FROM sales s JOIN titles t ON s.title_id = t.title_id GROUP BY t.title ORDER BY TotalSales DESC; — 2. Average Sales by Title SELECT t.title, AVG(s.qty) AS AverageSales FROM sales s JOIN titles t ON s.title_id = t.title_id GROUP BY t.title ORDER BY AverageSales DESC; — 3. Sales Count by Title SELECT t.title, COUNT(*) AS SalesCount FROM sales s JOIN titles t ON s.title_id = t.title_id GROUP BY t.title ORDER BY SalesCount DESC; |
Output:
Predictive Analytics
Predictive analytics can help businesses anticipate what will happen in the future, such as demand, revenue, costs, customer behavior, and market trends. Predictive analytics can also help businesses identify opportunities and risks, such as customer segmentation, churn analysis, fraud detection, and sentiment analysis.
SQL Server can perform predictive analytics by predicting and estimating future outcomes based on data using tools such as SSAS, Azure Analysis Services, SQL Server Data Mining, or Azure Machine Learning.
Prescriptive analytics
Prescriptive analytics can help businesses determine what actions to take in the future, such as pricing, marketing, inventory, staffing, and operations. Prescriptive analytics can also help businesses optimize actions like resource allocation, scheduling, routing, and simulation.
SQL Server can recommend and optimize actions based on data using tools such as SSAS, Azure Analysis Services, SQL Server Data Mining, or Azure Machine Learning.
Conclusion
SQL Server is a comprehensive, integrated platform capable of handling various aspects of BI, from data sources to decision-making. It offers a range of tools and services that can meet the different needs and preferences of BI users and developers.
In this article, you have studied various applications of SQL Server for different BI tasks, such as importing data from different sources, analyzing and mining data, creating reports and dashboards, and data-driven decision-making.