Power BI measure creation in parallel with a quick measure
Power BI measure is the core of dax. Whenever you start working on your power bi projects, you don’t need to create power bi measure right away. Measures execute on report level or an aggregate level to compute the provided data.
We need to import the sample Adventureworks excel dataset. It has different sheets in it named Category, Subcategory, Product, and Sales, etc.
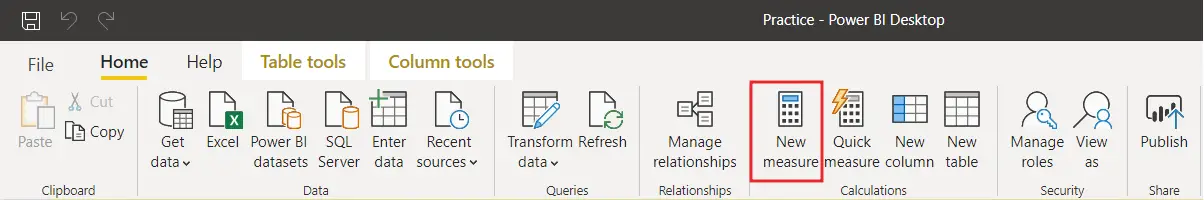
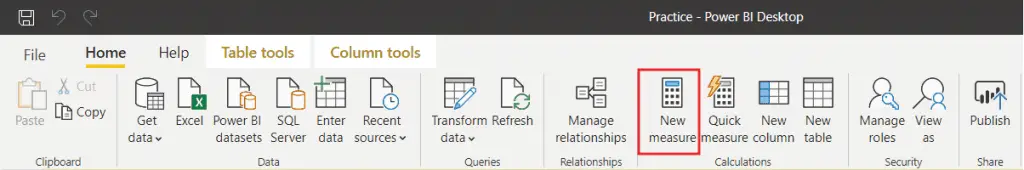
First, we need to select a table where you want to store your dax measure and then click the “New measure” tab on the ribbon, as you can see below.
Before clicking on the “New measure” tab, you first need to select the report tab enclosed in the orange circle and then create a measure below.
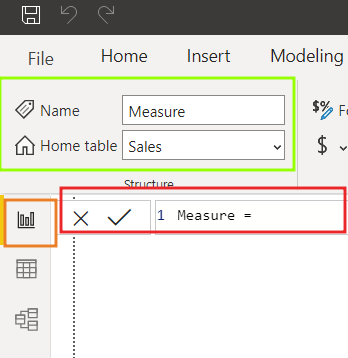
In the green box, you can see the following options.
- Name: This is the name of your measure. Whatever name you will write, it will be displayed in front of the “Name” label.
- Home table: This is the table that you have selected before creating the power bi measure. You can see a drop-down list in the “Home Table” field where you can choose a table of your choice to save the newly created measure.
Measure only works if you provide aggregated data; otherwise, it throws an error as you can see below.
Let’s try to write one dax formula that will sum “Order quantity” and “Unit price” fields.
Sales Calculation = Sales[OrderQuantity] + Sales[Unit Price]
Whenever you try to write dax measure as above, IntelliSense will not work, and you will get an error message that can not find the “OrderQuanity” name. The error message will be the same for the “Unit Price” column.
If you ignore that message and complete your dax formula to compute Sale and press enter, you will get the following detailed error message.

The error message is about the aggregated value that is needed by the dax measure. All the measures in DAX can not work on the naked column. Before providing any column to the measure, this column first wrapped in any aggregated function like sum, min, and max, etc., and then the measure will not throw any syntax error.
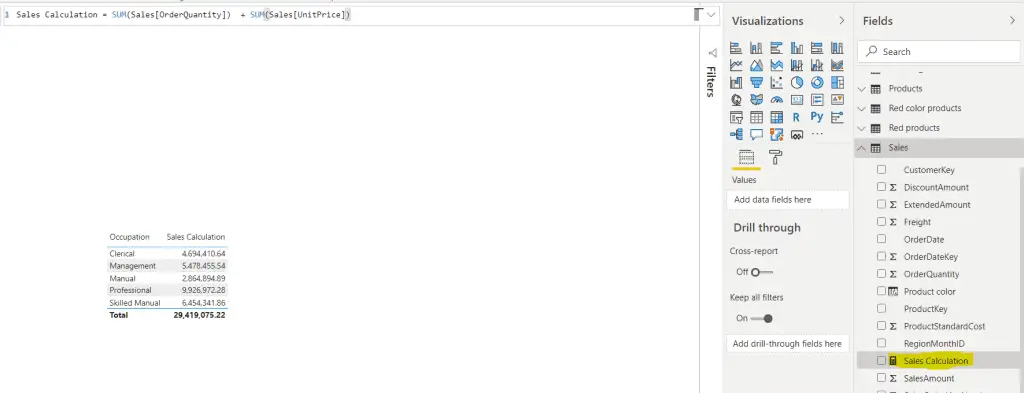
The following power bi measure will correctly calculate the sales.
Sales Calculation = SUM(Sales[OrderQuantity]) + SUM(Sales[UnitPrice])
In the above measure, the “OrderQuantity” and “UnitPrice” columns are wrapped inside the aggregated function named SUM.
How to create Power BI measure
Power BI measures can be created in the following tools.
- Power BI Desktop
- SQL Server Analysis Services Tabular mode
- Excel Power Pivot
As in this article, I am using Power BI Desktop. So let’s start how to create Sale measure step by step. Above, you have already seen how we can create a measure using the “New measure” option available on the ribbon.
Below, I will show the second method fo creating a measure.
- Select the table in which you want to create the measure.
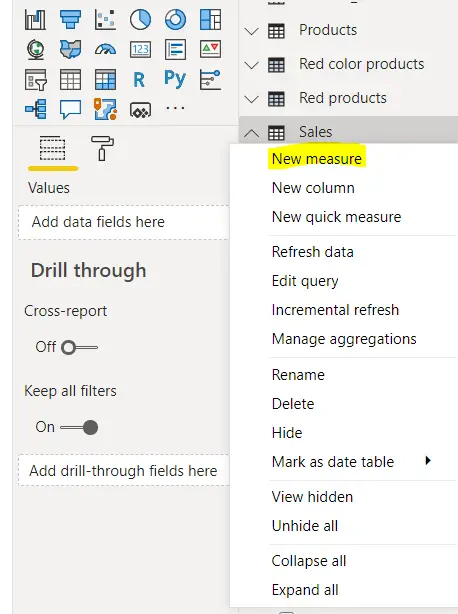
- In the right corner of the table, you will see three dots. Right-click on these dots, and you will see many options there.
- Click on the “New measure” option, and you will see the same dax measure formula bar that you had already seen above.
- Just give it a suitable name and then right the required dax formula/dax expression.
In SSAS Tabular and Excel power pivot, the setup to create measure will be slightly different but not complicated.
How to create a Power BI measure table
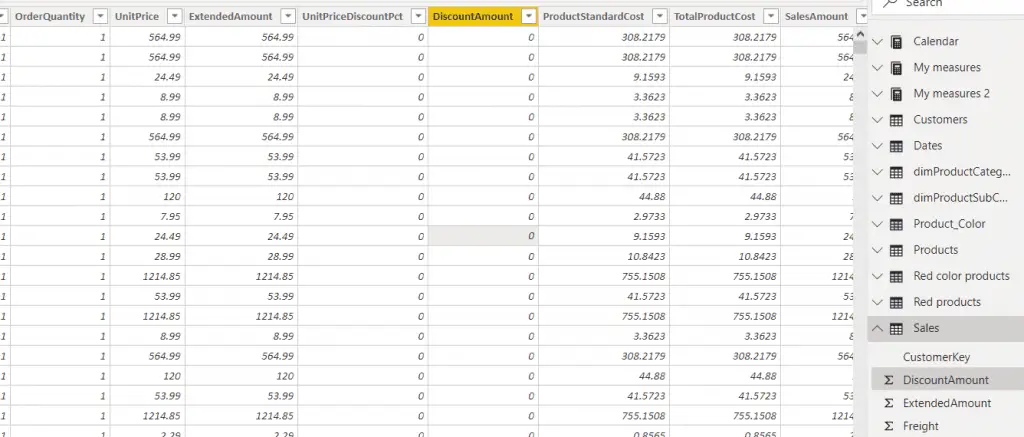
We have created a “Sales calculation.” measure inside the sales table. The sales table already contains a lot of columns and the newly created power bi measure, as you can see below.
Even if the measure has a different icon, it is still not easy to search for created measures in the existing table.
If we create many dax measures present in different tables, it will be quite hard for the Power BI author to utilize these measures in the dashboard.
Here we will discuss a method to create a separate table that will hold only dax measures, and it will be quite easy to search and utilize measures in the dashboard.
Below you can follow the steps.
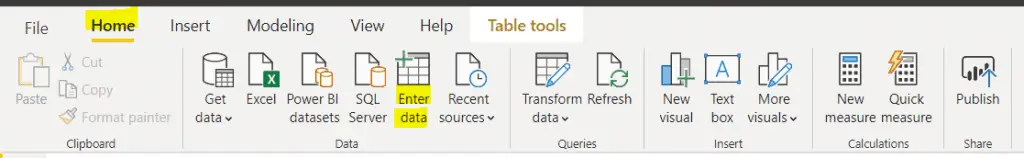
Select the “Home” tab and then click on the “Enter Data” option, as you can see below.
You can set the column name if you want and also write a proper name for the table. For this example, I have written “Sales measures.” as you can see below
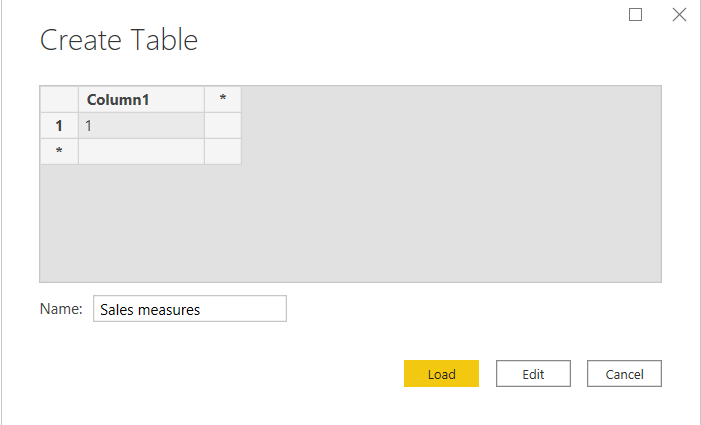
After writing the column name and table name and put numeric data in the column field, for this, I have written a numeric one and then click load. By clicking on load, the table will load into the power bi data model.
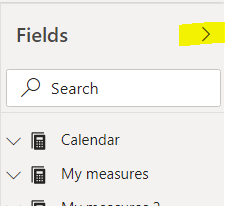
You will see no change at all. The “Sales measure” icon will be the same as we had other tables in the data model, as you can see below.
Now follow these steps.
- Select the newly created table, “Sales measures.”
- You can use any method to create a dax measure that we had already discussed above.
- Let’s choose the first method and create another measure with the following dax expression.
Sales greater than 200 = SUMX(FILTER(Sales,Sales[SalesAmount] > 200),Sales[SalesAmount] + Sales[Freight])
In this measure, we are calculating sales amount + sales freight for those transactions where the sales amount is greater than 200. For this, I have used SUMX function together with filter function.
The filter function is an iterative function that returns a table of those sales transactions where the sales amount is greater than 200.
The first parameter of the SUMX function must be a table. That is what we are getting from Filter function. After getting the filtered table, sumx iterate it row by row and calculate sales amount + fright.
Now we have finished with the creation of power bi measure. The “Sales measures” table now contains two values. The first value is the numeric number, and the second value is the newly created dax measure.
Right-click on the three dots on the right side of the “column1” value and select the delete option.
Once the measure is deleted, you have to click on the show hide pane of measures, as you can see below.
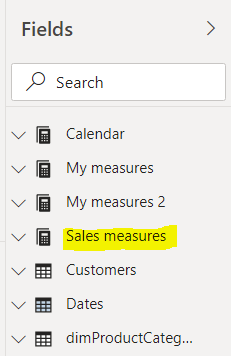
Just click on the pan two times to hide and show it. You will see that icon of “Sales measures” will be changed as you can see below. The “Sales measures” table now have only measures, and no regular column is inside.
How to create a quick measure in Power BI
If you are not comfortable creating power bi measure on your own, you don’t need to worry.
Below you can see a step-by-step method to create dax measure in power bi just by following the wizard.
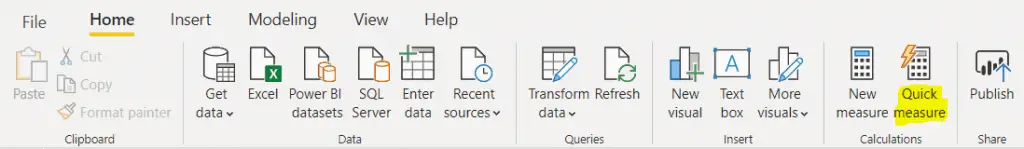
1- Click “quick measure” option on the Power BI ribbon as you can see below
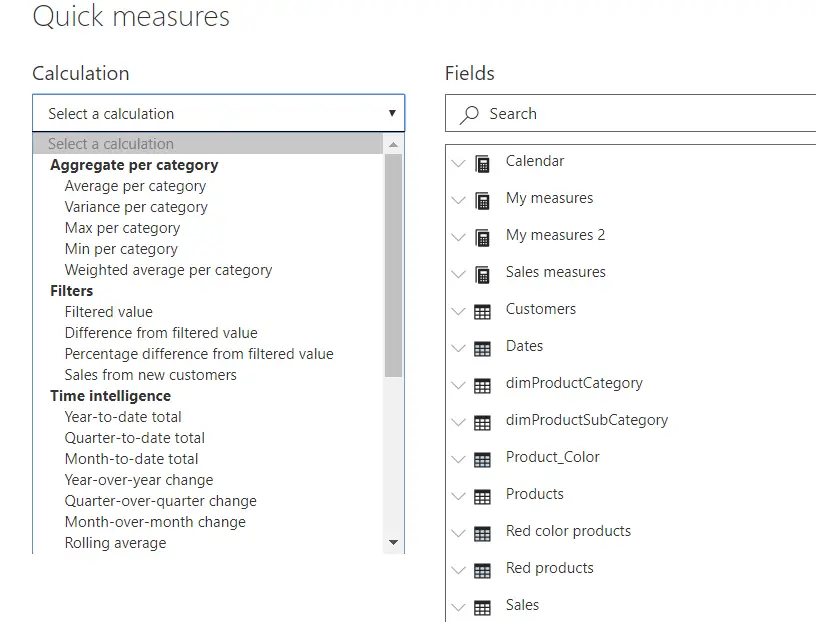
2- You will see another dialog box that contains Power BI calculation and filed option in it, as you can see below.
3- Under the calculation option, you will see some methods to calculate power bi measure.
Aggregate per category: By selecting this option, you can write pretty complex calculations based on grouping the data like min, max, or average, etc. per category.
Filters: If you want to use filters in your dax formula, you can choose a filter option to limit your records. The filter is a function in dax that returns a filtered table.
Time intelligence: If you want to work with dates, then the method provides you the flexibility to perform calculations based on date & time. Time intelligence functions one of the compelling functions in dax to deal with time-related data. For example, if you want to see your aggregated sales in the year to date, month to date, year to year, and many others.
Totals: When you want to calculate the total or running total in your dashboard reports, then this is the option that you need to choose.
Mathematical operations: If you need special mathematical functions in your calculation, then this is the option that you need to choose. It provides addition, subtraction, multiplication, division, percentage difference, and correlation coefficient.
Text: If you want to concatenate your data, which has a string data type. For example, you can use choose this method to concatenate in FirstName and Lastname together.
You have seen different options to build a power bi measure for your dashboard to solve the underlying business problems. You just need to choose the right method and the right table from which you are grabbing columns.
On the left side of the “Calculation” option, you can see the “Fields” option. Under the field option, all the tables exist in the data model. Here you can choose different columns.
From the calculation side, you need to choose the method, and from the right side, you need to select columns that will be used in the selected method to solve the business problem, as you can see below.
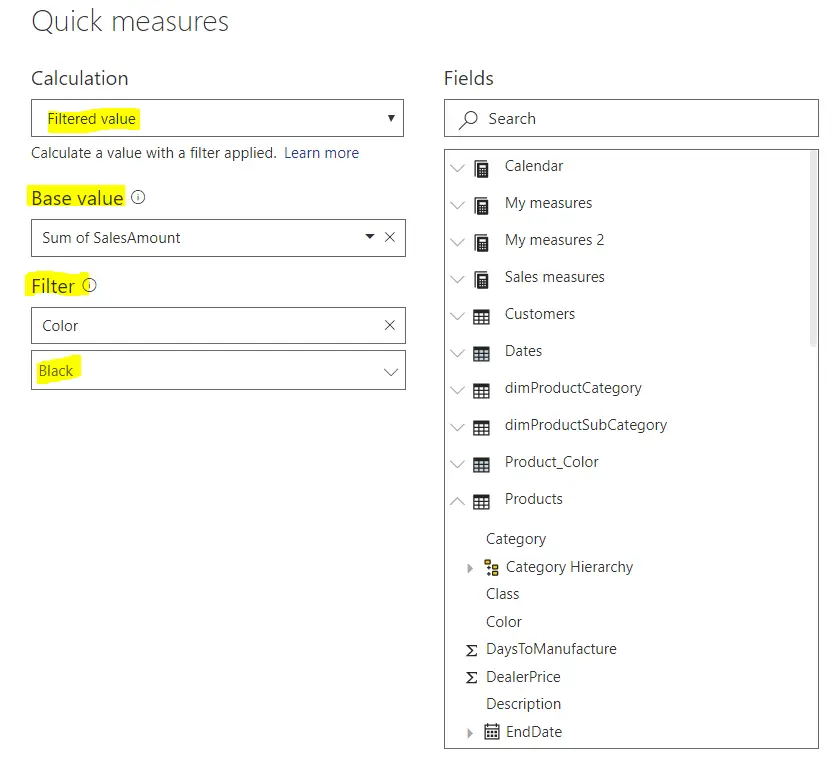
Le’s create one measure to calculate sales of all black color products. For this, we need to choose the filter method.
You need to click on the “Filter” method and choose the “Filtered value” option.
Drag the “Sales amount” and “color” columns as you can see below
In the dialog box, you will see the following options
Calculation: Here, you require to choose the function that you need to apply. In our example, I have selected the “Filtered value” option.
Base value: In the “Base value” field, you have to drag the column on which you want to perform the calculation. In our case, we have used the “Sales Amount” column.
Filter: Here, you need to provide a column on which filter will be applied. We needed to use a filter on the color column; that’s why the color column dragged in this field.
Once the color column is being dragged, the color values will be popped in the below field. We have chosen the “Black” color for our example.
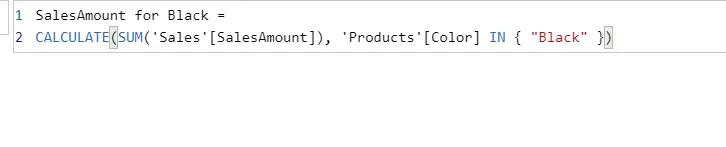
Click on the OK button, and you will see the newly created power bi measure using a quick measure method. The measure will be created in the table that you had first selected before clicking on the “quick measure” option.
Below you can see the final dax measure that power bi created for us.
Conclusion
In this article, we have seen some methods to create measures in power bi. If you are new to power bi, then a quick measure option will be better. When you create a dax measure using the quick measure, and you will have a solid understanding, it will be quite easy for you to create your measures in power bi.
Quick measures are not always a better option, and sometimes it creates a very complex measure that takes time to understand and make use of the business problem.
Below you can watch video on dax measure and learn how to create power bi measure simply. In this video, you will also learn why we need to measure rather than a calculated column.
For more useful blogs, please visit Learn DAX